Big data
To analyse where you are wasting energy, and utilities such as water, you need to have evidence lead data to make informed decisions. This is also known as “big data”. HeatingSave collects and stores meter readings each minute so that you have the granularity to be able to see the cause and effect. The same applies to other inputs such as temperatures, air quality and occupancy.
Data normalisation
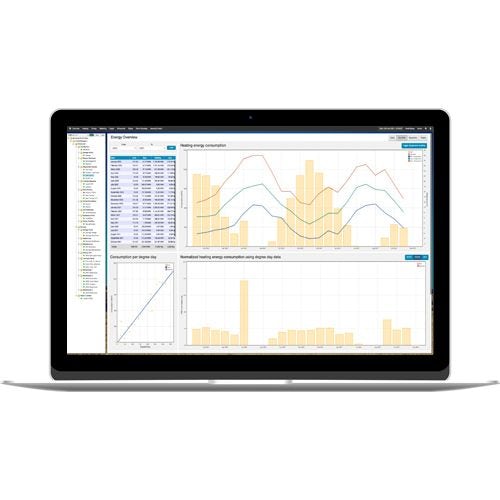
The starting point for the normalisation of most energy consumption related to heating is degree-day analysis. Since the outside temperature can vary significantly for site to site within a local geographical area, HeatingSave calculates the degree-days for each day for each site.
Regression analysis
The analysis of other datasets can be done by regressing the basic data against a number of criteria to determine trends or blips. The way this works will vary by site depending upon the activity and operation taking place. Data can also be exported in a number of different formats so that the user can perform their own analysis.
Graphical Display
HeatingSave has good graphing software allowing energy/utility consumption and other variables such as temperatures, occupancy and air quality to be shown on the same timeline.
Heat maps and other graphical display are useful for real-time alerts and when presenting data for reports, presentations and accreditations.
